Ethnicity Estimates Revisited

I completely forgot about looking at the percentage ranges when I wrote my last post about the new AncestryDNA ethnicity update. They are important because they emphasize how approximate the percentages remain, even if the updated profile is much improved.
Here again is my new ethnicity estimate:
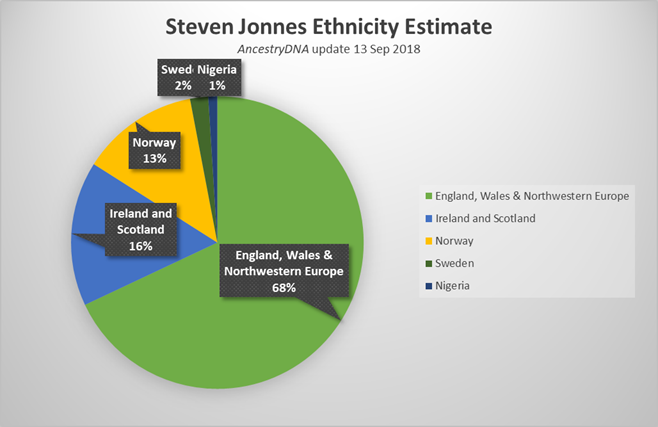
Steven Jonnes Ethnicity Estimate (Source: AncestryDNA)
And here are the ranges that AncestryDNA provides:
- England, Wales & Northwestern Europe (EWNE) = 67 – 95%
- Ireland and Scotland = 0 – 16%
- Norway = 0 – 30%
- Sweden = 0 – 2%
- Nigeria = 0 – 3%
These are not small ranges. 67 to 95% for EWNE is a 28-point difference. Norway shows a 30-point difference. Again, caution must be used when trying to come to conclusions from this data.
Nonetheless, the ranges help to show us, number one, how dominant my British ancestry is. Secondly, my concern about the low percentage of Norwegian ancestry (13%) is lessened by the knowledge that it could be as high as 30%.
I find it odd that 4 out of 5 of my ethnic categories show the possibility of zero percent. I’m sure that AncestryDNA has some legitimate mathematical reason why they’re showing zero for each category, but if you take the lowest possible percentage in each category and add them up, they only total 67% – which makes no sense. Even if you take the highest percentage for EWNE – 95% – it still doesn’t reach 100%. AncestryDNA probably doesn’t intend that the range figures be added together. Yet it’s particularly strange that both Ireland & Scotland and Norway have a low range of zero percent. The logarithm must give them this result, but my ancestors are screaming out for an acknowledgement of some percentage, because there is no way I don’t possess heritage from those two ethnicities. I have a grandfather who is 100% Norwegian, for Pete’s sake, as well as numerous Scottish, Irish, and Scots-Irish ancestors. (The technical explanation for the ranges may be found in an AncestryDNA white paper, available on their website.)
In a future upgrade, I predict the following:
- The 13% Norway component will increase
- The top range of 95% for EWNE will drop
- The low range of 0% for Ireland & Scotland will rise
I have no idea what will happen with Sweden or Nigeria, although I’d like to think that my Homan ancestry is Swedish and that I did inherit a little.
What will be really nice down the road is when ethnicity estimates get to the point where the DNA testing companies can tease out the percentage breakdowns for Celtic, Roman, Anglo-Saxon, Viking, and Norman populations within the EWNE category. That will require finding more ancient DNA for each of these groups. Of course, the bones in the ground don’t come with nice labels on them, so it’s not easy for archaeologists to perfectly determine ethnicity, even when they have the time and place correctly.

