My Ethnicity Estimate Just Changed!
Talk about good timing.
I just mentioned in a recent post that DNA ethnicity percentages are rough estimates and should be used with caution.[1]Steven Nelson Jonnes, “Understanding DNA Testing,” Jonnes Genealogy Blog, 25 August 2018 (https://www.jonnesgenealogy.com/understanding-dna-testing/), para. 9. Well, AncestryDNA, the largest provider of DNA tests in the world, just updated the ethnicity estimates for everyone in their database … and mine changed dramatically.
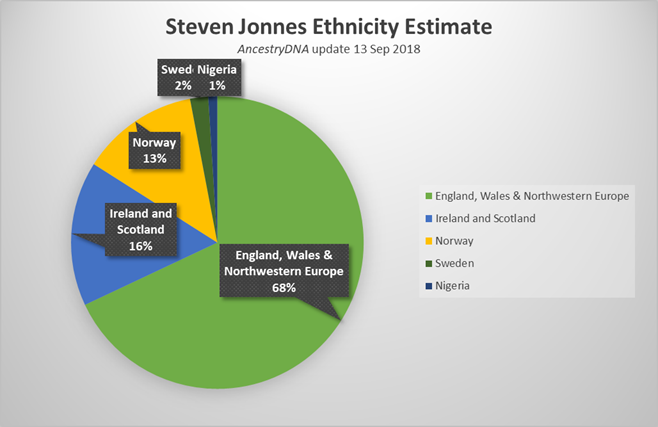
See the pie chart above for the new results.
And, here’s how the percentages changed from my previous estimate:

Steven Jonnes 2018 Ethnicity Estimate Changes (Source: AncestryDNA)
Two changes really jump out. One, my percentage of British ancestry jumped from 8% to 68%! Of course, if you add the 27% from the Europe West portion in my old estimate to the new Britain, Wales & Northwestern Europe category, it’s really more like 35% to 68% … but still, that’s a doubling of what they previously said. Two, most of the small percentage stuff disappeared. Previously, AncestryDNA assigned 7% to Iberia, 2% to Europe South, and less than 1% to places like Finland, Senegal, Polynesia, etc. These have all been removed from my estimate. The only 1% item remaining is Nigeria.
The new percentages make a lot more sense to me than the old ones. Honestly, I have been pretty frustrated with these ethnicity estimates for several years and found them nearly useless. It may be that the refining of the technology is finally approaching a more useful paradigm. The technology should continue to improve in the coming years, especially as more ancient DNA samples are discovered.
According to AncestryDNA, they were able to make these improvements for several reasons. First, they added 13,000 new samples to their reference populations compared to the original 3,000. Second, because of the increase in samples, they added more geographic regions and fine-tuned them, thereby improving the granularity of the estimates. Third, they improved their analytical algorithm for examining the genetic code.
The new estimate aligns much better with our family tree than any previous estimate. In general, it looks like I am primarily Celtic with a strong dose of Scandinavian ancestry. It is certainly more complicated than that, however, because AncestryDNA includes the Romans, Anglo-Saxons, Vikings, and Normans along with the Celts in the new England, Wales & Northwestern Europe category. Nonetheless, when you add the 16% for Ireland & Scotland, a full 84% of my ethnicity is from the British Isles in one form or another, a lot of which would be Celtic in origin. This is the first time in 7 years that I feel like my ethnicity estimate is telling me something meaningful. (Based on my tree alone, the vast majority of my known immigrant ancestors came from England, Wales, Scotland, and Ireland – except for two great grandparents from Norway and a few random Germans, Alsatians, Dutch, and French Huguenots.)
I’m a little surprised my Scandinavian percentage is showing this low. It dropped from 20% to 15% (Norway 13%, Sweden 2%). Given some of the rich centimorgans I share with Norwegian cousins and the fact that Grandpa Bonn was 100% Norwegian, I would have thought it would be more like 25%. But maybe I didn’t get as much from him as I imagined.
The Sweden connection is intriguing because Dad does have a suspected Swedish ancestor.
Although I have never been able to prove the lineage because of missing links in the 18th century, it is likely that our Homan ancestors go back to Anders Andersson Homman (1620-1700), who came to New Sweden (Wilmington, Delaware) in 1643 as a soldier & trumpeter with the Swedish expedition to the New World. His wife was also Swedish (or Finnish). Anders later settled in West Jersey. Repaupo Creek in Greenwich, New Jersey was first named Trumpeter’s Creek, then Homman’s Creek. Here’s an amazing photograph of Joel Homan (1808-1883), my 3GG, who moved from New Jersey to Williamsburg, Ohio at age 7.

3GG Joel Homan (1808-1883)
The Nigeria 1% is also interesting. I suspect this might be eliminated in a future update because we currently have no African individuals in our family tree. Also, my FamilyTreeDNA estimate says I have less than 1% West African in my makeup, which could be due to what they describe as “background noise.” However, there are many gaps in our tree when you go back 8 to 12 generations, so it is possible that an early colonial ancestor may have been Nigerian. Something to keep an eye out for. Although entirely speculative, our Blalock line appears to originate in the Carolinas so maybe they owned slaves.
It is important to keep in mind that the percentages for my siblings would be somewhat different, although all of us have British, Irish, Western Europe, and Norwegian ethnicity in some combination. Of course, even if I am 1% Nigerian, my siblings may have more or less, or none at all. Ditto with the 2% Swedish component.
I think FamilyTreeDNA needs to update their ethnicity estimates as well. According to their Family Finder test, some of my siblings have Eastern European ethnicity. This is completely mystifying. Sara supposedly has 26%! Given the scope of the changes wrought by yesterday’s announcement from AncestryDNA, I predict this Eastern Europe percentage will disappear or be significantly lower when FamilyTreeDNA gets around to updating its ethnicity estimates.
References
| ↑1 | Steven Nelson Jonnes, “Understanding DNA Testing,” Jonnes Genealogy Blog, 25 August 2018 (https://www.jonnesgenealogy.com/understanding-dna-testing/), para. 9. |
|---|

